|
|---|
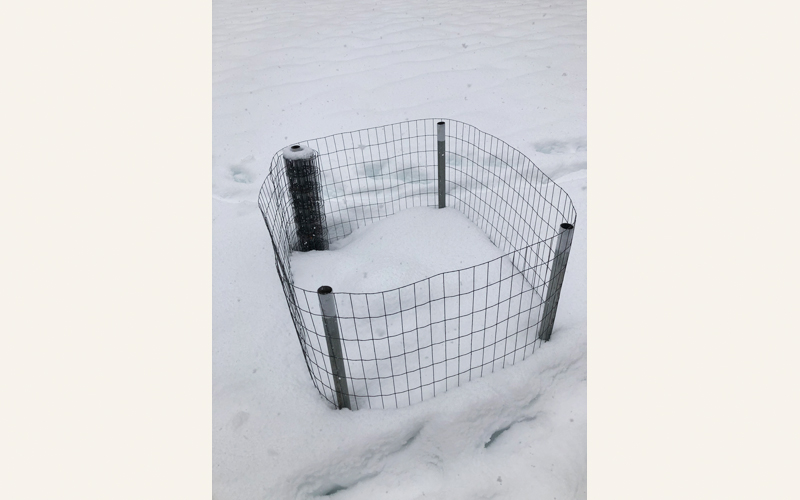
Snow fall end of February 2023 - the device was eventually covered by 3' of snow. Installation Date: 2-2-23 #2 Water production between 3-13-23 and 3-26-23 was 1.5 cups of pure water #3 Water production between 3-26-23 and 4-10-23 was 1.5 cups of pure water #4 Water production between 4-10-23 and 4-29-23 was 2.5 cups of pure water #5 Water production between 4-29-23 and 5-11-23 was 2.5 cups of pure water #6 Water production between 5-11-23 and 5-14-23 was .25 cups of pure water #7 Water production between 5-14-23 and 5-29-23 was 3.0 cups of pure water #8 Water production between 5-29-23 and 6-01-23 was .75 cup of pure water #9 Water production between 6-01-23 and 6-06-23 was 1.0 cup of pure water #10 Water production between 6-06-23 and 6-12-23 was 1.0 cup of pure water #11 Water production between 6-12-23 and 6-15-23 was 0.5 cup of pure water #12 Water production between 6-15-23 and 6-26-23 was 4 cups of pure water #15 Water production between 7-06-23 and 7-23-23 was 5.75 cups of pure water #16 Water production between 7-23-23 and 7-25-23 was .5 cup of pure water #17 Water production between 7-25-23 and 7-31-23 was 2.25 cups of pure water #18 Water production between 7-31-23 and 8-4-23 was 1.5 cup of pure water #19 Water production between 8-4-23 and 8-15-23 was 3.25 cups of pure water #20 Water production between 8-15-23 and 8-18-23 was .33 cup of pure water #21 Water production between 8-18-23 and 9-07-23 was 6.25 cups of pure water #22 Water production between 9-07-23 and 9-13-23 was 1.25 cups of pure water #23 Water production between 9-13-23 and 10-05-23 was 5.4 cups of pure water #24 Water production between 10-05-23and 10-09-23 was .5 cups of pure water #25 Water production between 10-09-23 and 10-12-23 was .75 cups of pure water #26 Water production between 10-12-23 and 11-03-23 was 4.3 cups of pure water #27 Water production between 11-03-23 and 11-07-23 was .8 cups of pure water #28 Water production between 11-07-23 and 11-11-23 was .75 cups of pure water #29 Water production between 11-11-23 and 11-19-23 was 1.25 cups of pure water #30 Water production between 11-19-23 and 11-25-23 was 1.5 cups of pure water #31 Water production between 11-25-23 and 12-02-23 was 1.7 cups of pure water #32 Water production between 12-02-23 and 12-09-23 was 1.25 cups of pure water #33 Water production between 12-09-23 and 12-16-23 was 1.25 cups of pure water #34 Water production between 12-16-23 and 12-24-23 was .9 cup of pure water #35 Water production between 12-24-23 and 12-30-23 was .75 cups of pure water #36 Water production between 12-30-23 and 01-06-24 was 1.25 cups of pure water #37 Water production between 01-06-24 and 01-15-24 was 1.25 cups of pure water #38 Water production between 01-15-24 and 01-20-24 was .3 cups of pure water #39 Water production between 01-20-24 and 01-27-24 was .75 cups of pure water
Daily Weather Observations:
|
Dedicated to Scientific Field Research for Climate Change Solutions |
|---|
|
© 2023
Len Bruffett
|
|---|